Your first temperature alarm dashboard
Goal: move a simulated temperature slider. Device turns red at 80 or above and returns to its original color below the threshold. Allow 25–35 minutes.
See the result first
Turn a changing value into visible device status: drag the temperature slider and watch the device turn red at the threshold. Learn UI input, alarm rules and chart field mapping.
Actual screenshots of the completed example. Click an image to enlarge it.
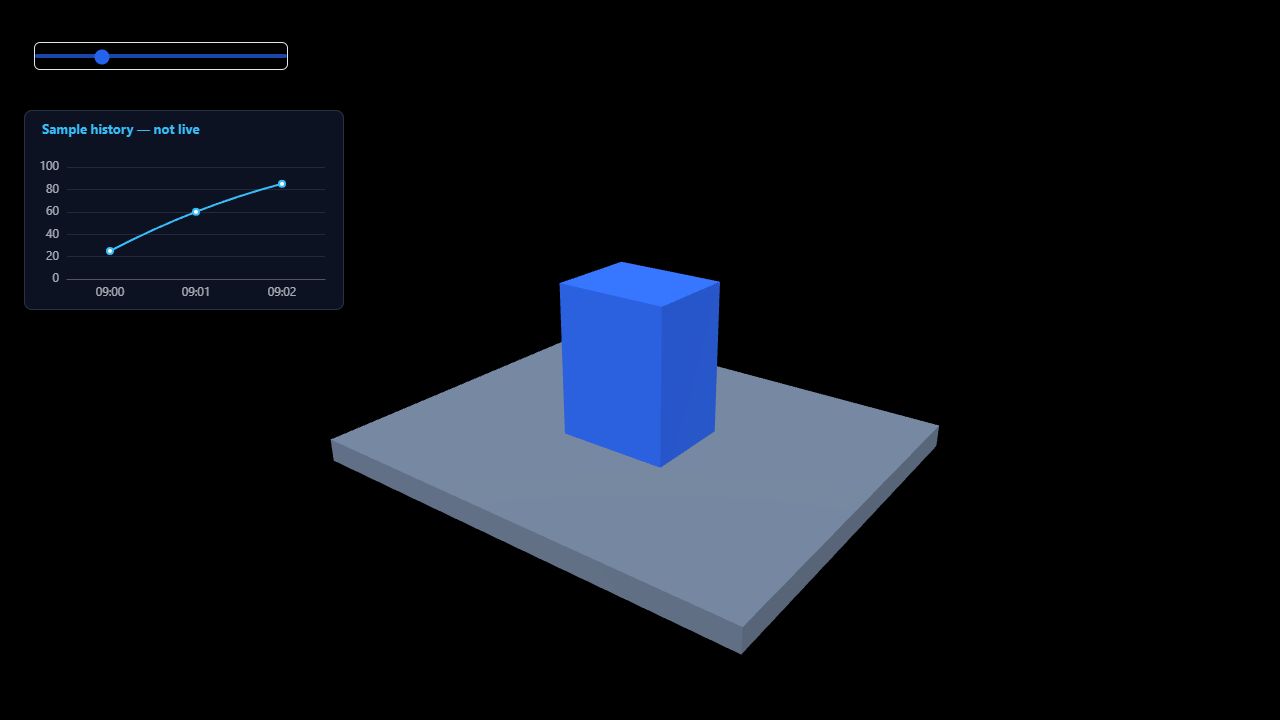
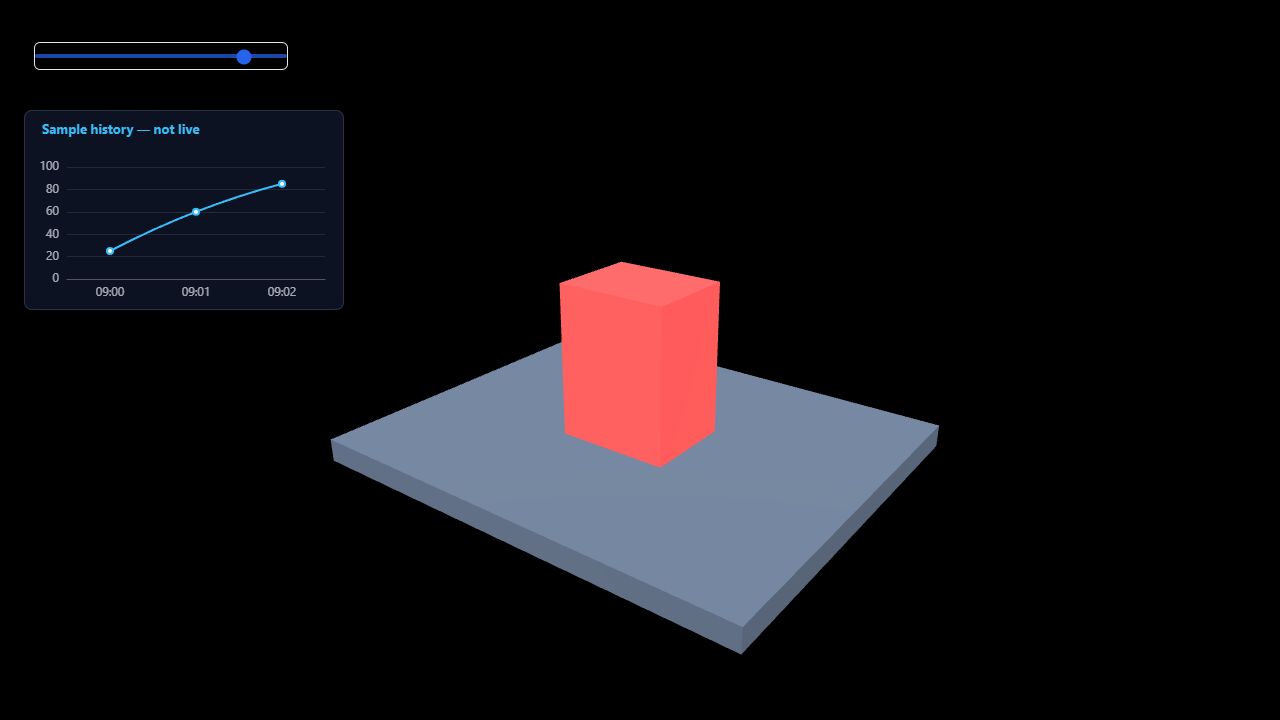
The slider is simulated input. The chart is a static sample, not live equipment data, and does not change with the slider.
Try it yourself
Starting archive · Completed archive · History data
This lesson uses manual simulated input, not a live PLC. The history chart is static and does not follow the slider.
1. Configure the device
Import the starting ZIP and select Device. Open Status Linkage and Alarm in the device business tools and create a Temperature configuration targeting Device.
2. Add a rule
Name it High temperature. Choose greater than or equal (gte), threshold 80, severity critical and color #ef4444. Disable alarm annotations for this first exercise if desired. Save and copy the configuration ID.
3. Add simulated input
In 2D Layer, add a Slider named Temperature (simulated). Set minimum 0, maximum 100, step 1 and initial value 25. Add action business.statusAlarm.evaluate, command evaluate, the current Device target and the saved configurationId. Slider values are passed to rule evaluation.
4. Add a history chart
Add a Line Chart with Static data, X field time and Y field value. Label it “Sample history — not live”. Paste this array:
[{"time":"09:00","value":25},{"time":"09:01","value":60},{"time":"09:02","value":85}]The downloadable JSON wraps the array in data. Paste only the array into Static Data.
5. Check the boundary
Save, run and start the session. Test 79, 80, 85 and 25. Expect the original color at 79, red at 80 and 85, then the original color at 25. Repeat three times and reopen the saved project to check persistence.
If color does not change, check the runtime, target and configuration ID. If the chart is empty, check its JSON and field names. A chart that does not track the slider is expected: these are separate static history and simulated current-value exercises.
Next: data connections.